This is about a political post, but this post isn’t political but purely about the statistics. A Lords Labour MP recently wrote:
We often read that there is a plus or minus 2 or 3% statistical margin of error in a poll. But what we are rarely reminded of is that this error applies to each party’s vote. So if a poll shows the Tories on 40% and Labour on 34%, this could mean that the real situation is Tory 43%, Labour 31% – a 12 point lead. Or it could mean both Tory and Labour are on 37%, neck and neck.
But is this true, mathematically?
When we say “Tories on 40% ± 3%” we mean:

A Normal Distribution with mean 40, and standard deviation of 3/1.96
Let’s plot both on the same graph:

Which was achieved in Wolfram Alpha with:
Plot[{PDF[NormalDistribution[40, 3/1.96], x],
      PDF[NormalDistribution[34, 3/1.96], x]},
      {x, 30, 44}]
Now, could Labour and Tory really be neck and neck, within our 95% confidence?
If they are not correlated at all, then no:
To subtract normal distributions you have to do:
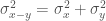
so:
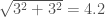
So, at 95% confidence, the difference in their lead is: 6 points ± 4.2. As a plot:

The Neck-and-neck 0 point lead and the 12 point lead are really unlikely outcomes! (0.3% in fact)
(Caveat: Of course this all depends on the polls being accurate normal samples on the population).
But of course they are correlated… somewhat
If this was a two party system, with the total adding up to 100%, then the errors would be completely anti-correlated. And if it was a many party system, with the total adding up to much less 100%, then we’d expect the errors to have a very weak correlation. But with the errors adding up 70% we’re stuck in an awkward half-correlated stage. Is there anything better that we can do?
Edit: Response from the Lords MP
I received a message from the MP:
I take your point but don’t entirely agree. The errors are associated ie high Tory is likely to mean low Labour and vice versa so these are linked contingencies.
But thanks for writing. And at least even if your point was accepted entirely it wouldn’t make any material difference to the conclusions of my article.
D

