I couldn’t find anyone else that has done this, so I made this really quick guide. This uses tensorflow which is a complete overkill for this specific problem, but I figure that a simple example is much easier to follow.
Install and run python3 notebook, and tensorflow. In Linux, as a user without using sudo:
$ pip3 install --upgrade --user ipython[all] tensorflow matplotlib
$ ipython3  notebook
Then in the notebook window, do New->Python 3
Here’s an example I made earlier. You can download the latest version on github here: https://github.com/johnflux/Spike-Triggered-Average-in-TensorFlow
Spike Triggered Average in TensorFlow
The data is an experimentally recorded set of spikes recorded from the famous H1 motion-sensitive neuron of the fly (Calliphora vicina) from the lab of Dr Robert de Ruyter van Steveninck.
This is a complete rewrite of non-tensorflow code in the Coursera course Computational Neuroscience by University of Washington. I am thoroughly enjoying this course!
Here we use TensorFlow to find out how the neuron is reacting to the data, to see what causes the neuron to trigger.
%matplotlib inline
import pickle
import matplotlib.pyplot as plt
import numpy as np
import tensorflow as tf
sess = tf.InteractiveSession()

FILENAME = 'data.pickle'

with open(FILENAME, 'rb') as f:
    data = pickle.load(f)

stim = tf.constant(data['stim'])
rho = tf.constant(data['rho'])
sampling_period = 2 # The data was sampled at 500hz = 2ms
window_size = 150 # Let's use a 300ms / sampling_period sliding window
We now have our data loaded into tensorflow as a constant, which means that we can easily ‘run’ our tensorflow graph. For example, let’s examine stim and rho:
print("Spike-train time-series =", rho.eval(),
      "\nStimulus time-series     =", stim.eval())
Spike-train time-series = [0 0 0 ..., 0 0 0]
Stimulus time-series    = [-111.94824219  -81.80664062
    10.21972656 ...,  9.78515625 24.11132812 50.25390625]
rho is an binary array where a 1 indicates a spike. Let’s turn that into an array of indices of where the value is 1, but ignoring the first window_size elements.
Note: We can use the [] and + operations on a tensorflow variable, and it correctly adds those operations to the graph. This is equivalent to using the tf.slice and tf.add operations.
spike_times = tf.where(tf.not_equal(rho[window_size:-1], 0)) + window_size
print("Time indices where there is a spike:\n", spike_times.eval())
Time indices where there is a spike:
 [[   158]
 [   160]
 [   162]
 ...,
 [599936]
 [599941]
 [599947]]
def getStimWindow(index):
    i = tf.cast(index, tf.int32)
    return stim[i-window_size+1:i+1]
stim_windows = tf.map_fn(lambda x: getStimWindow(x[0]), spike_times, dtype=tf.float64)
spike_triggered_average = tf.reduce_mean(stim_windows, 0).eval()
print("Spike triggered averaged is:", spike_triggered_average[0:5], "(truncated)")
Spike triggered averaged is: [-0.33083048 -0.29083503 -0.23076012 -0.24636984 -0.10962767] (truncated)
Now let’s plot this!
time = (np.arange(-window_size, 0) + 1) * sampling_period
plt.plot(time, spike_triggered_average)
plt.xlabel('Time (ms)')
plt.ylabel('Stimulus')
plt.title('Spike-Triggered Average')

plt.show()
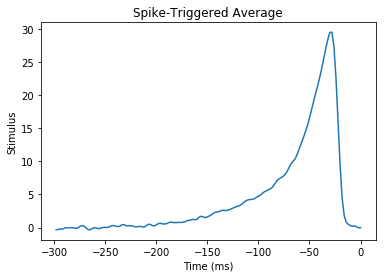
It’s… beautiful!
What we are looking at here, is that we’ve discovered that our neuron is doing a leaky integration of the stimulus. And when that integration adds up to a certain value, it triggers.
Do see the github repo for full source: https://github.com/johnflux/Spike-Triggered-Average-in-TensorFlow
Update: I was curious how much noise there was. There’s a plot with 1 standard deviation in light blue:
mean, var = tf.nn.moments(stim_windows,axes=[0])
plt.errorbar(time, spike_triggered_average, yerr=tf.sqrt(var).eval(), ecolor="#0000ff33")
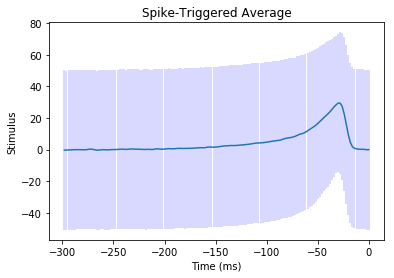
Yikes! This is why the input signal MUST be Gaussian, and why we need lots of data to average over. For this, we’re averaging over 53583 thousand windows.
