For my self-driving car, I detect cars in the image by scanning over the image in windows of varying sizes, and use the detection results to build up a ‘heat map’ of the most likely areas for where the cars are.
For visualization I came up with this idea:
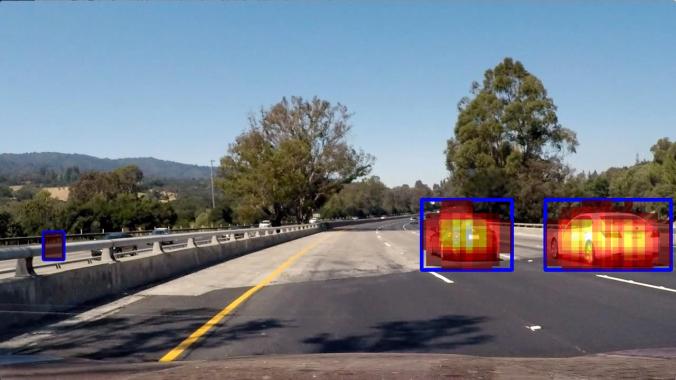
In code:
heat_img = plt.cm.hot(heat/np.max(heat))
heat_img[heat<1,3] = 0 image2 = np.copy(image) image2[heat>1,:] = image2[heat>1,:]/3 + (heat_img[heat>1,0:3]*256*2/3).astype(np.uint8)
plt.imshow(image2)
