Why Kalman Filters are broken, and how to fix

Okay, so clickbait title, because I’m referring to the most common case of using a single Gaussian distribution to represent the current estimated position (for example) and for the measurement.

Here’s my problem with that:

They don’t take into account that sometimes things go wrong.

Now you may say ‘duh’, but it can cause some really serious problems if something does go wrong.

Say you have a self driving car.  And the following happens:

  • Prior: You currently estimate the position of a person in front of you to be at position:  x = 2m ± 0.5m     aka   X ~ N(2,0.5)
  • Data:  Your instruments return a new measure:  the person is now measured to be at position: x = 10m ± 0.5m   aka    X ~ N(10,0.5)
  • Posterior: You apply your Kalman Filter and it concludes that the position of the person is now at:  x = 6m ± 0.25m  aka   X ~ N(6,0.25)

gaussian1

  • You are now extremely confident that the person is at x=6m despite you previously thinking that they were at a x=2m and your measurement data says that they are at x=10m.  You, the self driving car, now happily drive at x=10m.


How confident would you, as a, human, really be that the person is at x=6m?  Barely at all, right?  So something has gone wrong here.

Here’s an example in a simulator.  A car is driving from right to left and we are trying to track its true position with a Extended Kalman Filter.  ◯ The red circles indicate data from the simulated LASER, ◔ blue circle circles are RADAR, and ▲ green triangles are the position estimated by a Kalman filter.  At the bottom of the arc, a single bad LASER data point is injected.

Screenshot_20170801_170644

Credit to Udacity for the simulator.

The result is that the predicted position goes way off, and takes many times steps to recover.

The blame all lies on Sherlock Holmes:

sherlock

The product of N(2,0.5) * N(10,0.5) results in a ridiculous improbable scenerio – we have to scale up the result by 10^{14} .  i.e. treating the highly improbable as truth.  Perhaps what Sherlock should have said is that it is far more likely that you were simply mistaken in elimination!  i.e. your prior or data was wrong!

Fixing the basic Kalman Filter

Here’s a small change we could make.  We can add a small probability of ‘wtf’ to our system.

  • Prior: You currently estimate the position of a person in front of you to be at position:  x_{prior} = 2 \pm 0.5   plus a W_{prior} chance of ‘wtf’:   aka:X \sim (1-W_{prior}) \cdot N(2,0.5) + W_{prior} \cdot \textrm{WTF}
  • Data:  Your instruments return a new measure:  the person is now measured to be at position: x_{data} = 10 \pm 0.5   plus a W_{data} chance of ‘wtf’:   aka:
    X \sim (1-W_{data}) \cdot N(10,0.5) + W_{data} \cdot \textrm{WTF}

  • Posterior: You apply your bayes rule.  What do we get now?  We need the product of these two random variables, and then normalize, by setting C such that the total integral is 1.\displaystyle{ \left( (1-W_{prior}) \cdot N(2,0.5) + W_{prior} \cdot \textrm{WTF} \right) \cdot \left(  (1-W_{data}) \cdot N(10,0.5) + W_{data} \cdot \textrm{WTF} \right) / C}(note that N(10,0.5) \cdot N(2,0.5) is proportionate to a new Gaussian scaled by a factor S)= ( (1-W_{prior}) \cdot (1-W_{data}) \cdot N(6,0.25) \cdot S + (1-W_{prior}) \cdot W_{data} \cdot N(2,0.5) +
    W_{prior} \cdot (1-W_{data}) \cdot N(10,0.5) + W_{prior} \cdot W_{data} \cdot \textrm{WTF}^2 ) / C We know that the area must equal 1 for a PDF, so we can determine the scale factor C.  See Appendix below for any technical details, including the formula for S and C.So we have a solution, but the solution is a gaussian mixture model – a sum of a gaussian for the combination, a gaussian for the prior, and a gaussian for the data.  So let’s simply pick the one with the highest probability, and roll the other two into the WTF weight.

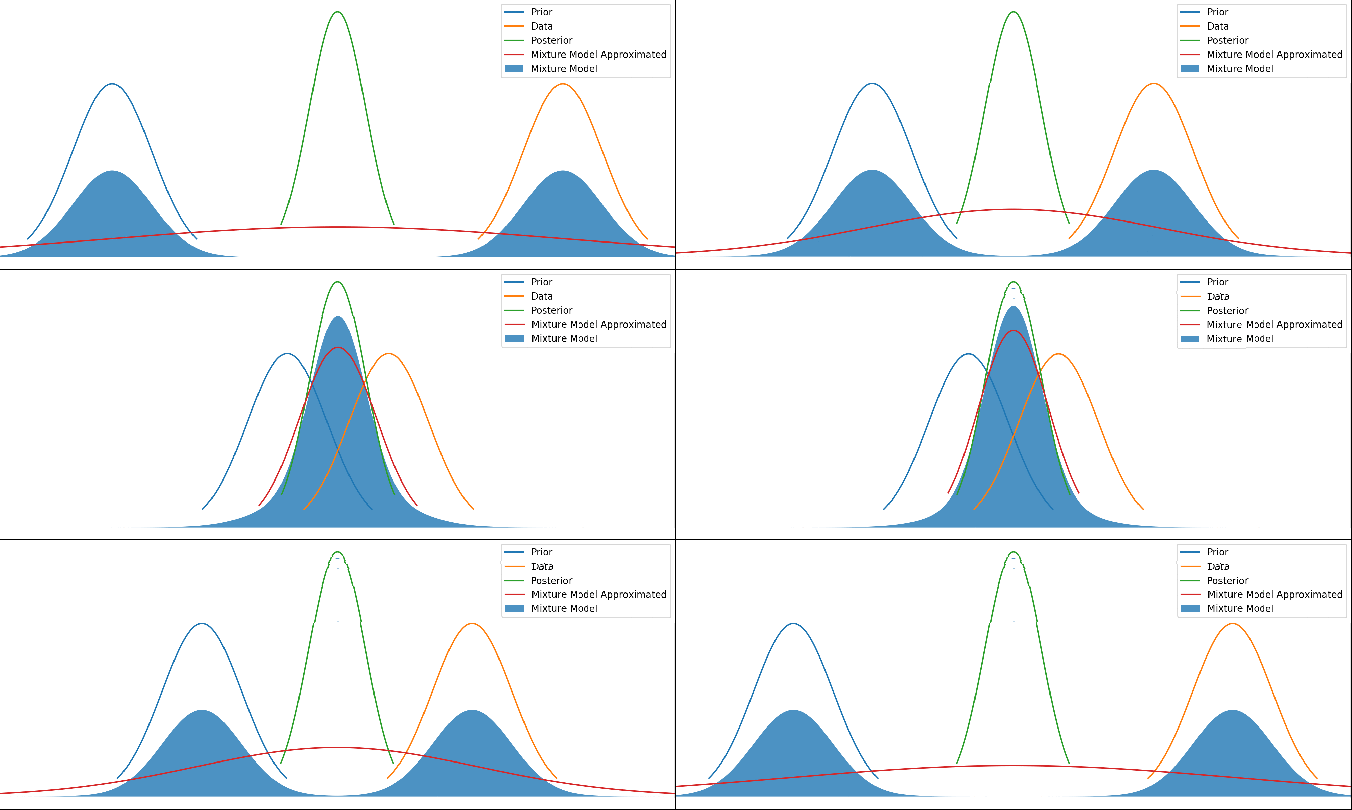
Here’s the result as an gif – the posterior is where the posterior would normally be, and the shaded blue area is our ‘wtf’ version of the posterior as a weighted mixture model:

anim.gif

Various different priors and data.  There’s no updating step here – just showing different mean values for the prior and data.  The posterior is kept centered to make it easier to see.

It looks pretty reasonable!  If the prior and data agree to within their uncertainties, then the mixture model just returns the posterior.  And when they disagree strongly, we return a mixture of them.

Let’s now make an approximation of that mixture model to a single gaussian, by choosing a gaussian that minimizes the KL divergence.

Screenshot_20170726_015120

Which results in the red line ‘Mixture Model Approximated’:

animapprox.gif

Different priors and data, with the red line showing this new method’s output.  As above, there’s no update step here – it’s not a time series.

Now this red line looks very reasonable!  When the prior and data disagree with each other, we have a prediction that is wide and covers both of them.  But when they agree with each other to within their uncertainties, we get a result that properly combines both and gives us a posterior result that is more certain than either – i.e. we are adding information.

In total, the code to just take a prior and data and return a posterior is this:
(Note: I’ve assumed there are no covariances – i.e. no correlation in the error terms)

# prior input
mu1 = 5
variance1 = 0.5
# data input
mu2 = 6
variance2 = 0.5
# This is what you would normally do, in a standard Kalman Filter:
variance3 = 1/(1/variance1 + 1/variance2)
mu3 = (mu1/variance1 + mu2/variance2)*variance3

#But instead we will do:
S = 1/(np.sqrt(2*np.pi*variance1*variance2/variance3)) * np.exp(-0.5 * (mu1 - mu2)**2 * variance3/(variance1*variance2))
Wprior = 0.01 # 1% chance our prior is wrong
Wdata = 0.01 # 1% chance our data is wrong
C = (1-Wprior) * (1-Wdata) * S + (1-Wprior) * Wdata + Wprior * (1-Wdata)
weights = [
Wprior * (1-Wdata) /C, # weight of prior
(1-Wprior) * Wdata /C, # weight of data
(1-Wprior) * (1-Wdata) * S/C ] #weight of posterior
mu4 = weights[0]*mu1 + weights[1]*mu2 + weights[2] * mu3
variance4 = weights[0]*(variance1 + (mu1 - mu4)**2) + \
weights[1]*(variance2 + (mu2 - mu4)**2) + \
weights[2]*(variance3 + (mu3 - mu4)**2)

So at mu3 and variance3  is the green curve in our graphs and is the usual approach, while mu4 and variance4 is my new approach and is a better estimation of posterior.

The full ipython notebook code for everything produced here, is in git, here:

https://github.com/johnflux/Improved-Kalman-Filter/blob/master/kalman.ipynb

Results: Testing out in Simulator

Unfortunately, in my simulator my kalman filter has a velocity component, which I don’t actually take into in my analysis yet.  My math completely ignores any dependent variables.  The problem is that when we increase the uncertainty of the position then we also need to increase the uncertainty of the velocity.

To salvage this, I used just a small part of the code:

<div>
<div>double Scale = 1/(sqrt(2*M_PI*variance1*variance2/variance3)) * exp(-0.5 * (mu1 – mu2)*(mu1 – mu2) * variance3/(variance1*variance2));</div>
<div>
<div>
<div>if (Scale < 0.00000000001)
return; /* Just completely ignore this data point */</div>
</div>
</div>
</div>

The result is this:

Screenshot_20170802_012822

Appendix:

Just some technical notes, for completeness.

  • We can set WTF = 1/(2A) where it can be anywhere between A and -A.  We can take A to be large or even take the limit to infinity.
  • It is a Probability Density Function since the area is 1:  \int^A_{-A} 1/(2A) dx  =  1 , and can set the Cauchy principal value of the integral to be 1 to keep it a PDF in the limit.
  • \int^A_{-A} \textrm{WTF}^2(x) dx \to 0 since:  \int^A_{-A} 1/(2A)^2 dx  =  2A/(4A^2) = 1/(2A)   which tends to 0 as A  \to \infty.
  • The scale factor S is simple but tedious to calculate:
    Screenshot_20170725_224207
  • The scale factor C can then be calculated by just setting the integral to equal 1 since it’s a PDF:  C = (1-W_{prior}) \cdot (1-W_{data}) \cdot S + (1-W_{prior}) \cdot W_{data} + W_{prior} \cdot (1-W_{data})

Python heat map image

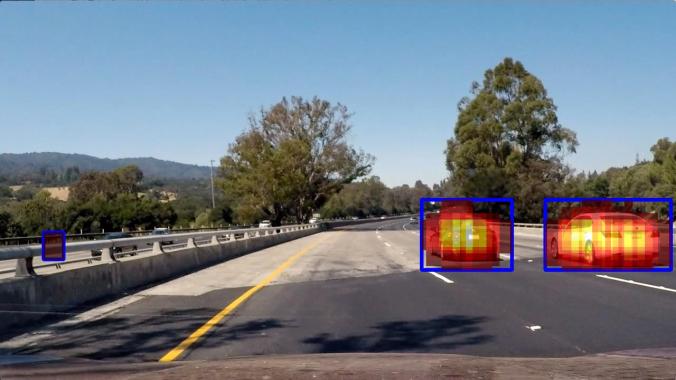
For my self-driving car, I detect cars in the image by scanning over the image in windows of varying sizes, and use the detection results to build up a ‘heat map’ of the most likely areas for where the cars are.

For visualization I came up with this idea:

heatmap_integrated_4

In code:

heat_img = plt.cm.hot(heat/np.max(heat))
heat_img[heat&lt;1,3] = 0 image2 = np.copy(image) image2[heat&gt;1,:] = image2[heat&gt;1,:]/3 + (heat_img[heat&gt;1,0:3]*256*2/3).astype(np.uint8)
plt.imshow(image2)

My Self Driving Car on a difficult track at speed

Well, in a simulator 🙂

(Sorry about the bad filming – it was the easiest way to get even a semi-decent quality)

Code is here: https://github.com/johnflux/CarND-Behavioral-Cloning-P3

I basically follow the NVidia End to End Learning for Self-Driving Cars paper with a few tweaks to add in dropout, slightly larger Dense layers to compensate, and an additional convolution layer to handle the different input image resolution.  It runs in real time on a GTX 980 Ti.

Tips on machine learning with TensorFlow / Keras

I see people new to machine learning make the same sort of mistakes.  Mistakes that I’ve made myself and then painstakingly tried to fix.  So here’s some hints that I’ve had to work out the hard way, along with some code.

As an example, I’ve used my self driving car code, which I’ll put up on the web.

  • Plot your input and expected output data!  For the training, validation and test data, individually.  It’s too easy to accidentally shuffle your data in the wrong place or to have unbalanced data etc.

    Example:

    def showDrivingAngles(samples, title="samples"):
        plt.hist([sample.driving_angle for sample in samples ], 16)
        plt.title("Driving angle distribution in " + title)
        plt.show()
    showDrivingAngles(samples)
    
  • Make sure your data is balanced, by over-sampling, under-sampling or generating fake data.

    Example to over-sample:  (Suggestions on making this better are welcome!)

    def duplicateSamplesToRebalanceByDrivingAngle(samples):
        # Bin the data, returning an array of which bin each sample is in
        num_bins = 16
        indexes = np.digitize([sample.driving_angle for sample in samples], np.arange(-1, 1, 2/num_bins))
        # Find how many samples are in the largest bin
        largest_bin_count = np.max(np.bincount(indexes))
        print(largest_bin_count)
        rebalanced_samples = []
        for j in range(num_bins):
            bin_indexes = np.where(indexes==(j+1))[0]
                for i in range(largest_bin_count):
                    rebalanced_samples.append(samples[bin_indexes[i % len(bin_indexes)]])
        random.shuffle(rebalanced_samples)
        return rebalanced_samples
    

    (And of course, plot your data afterwards like above, to check that it worked correctly)

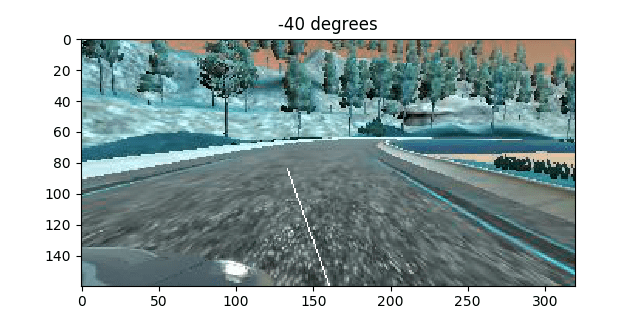
  • View random samples of your data after preprocessing.  It’s worthwhile to get a bit fancy here.  Show the label for the data here.  For example, I draw an arrow directly on the image to indicate which direction the label says that it should go in:
    image = self.getImage()
     s = image.shape
     line_len = s[0]//2
     angle = self.driving_angle / 360 * np.pi * 100 # Times 100 just to make it more visible
     line_y, line_x = int(line_len * np.cos(angle)), int(line_len * np.sin(angle))
     rr,cc = draw.line(s[0]-1, s[1]//2, s[0]-1-line_y, s[1]//2 + line_x)
     image[rr,cc,:] = 255
     plt.imshow(image)
     plt.title("{} degrees".format(float(self.driving_angle)))
     plt.show()
    

    view from right driving straight

  • Check your colorspace! Notice that in the image above, the colors are all wrong. This was totally on purpose, to demonstrate another point – Make sure you understand what colorspace your data is in! cv2.imread() return BGR. While almost everything else is going to use RGB. I highly recommend converting to YUV immediately, and using that everywhere. Make sure you do this in both the code that trains the model, and code that uses the model.
  • You can do preprocessing in the model itself.  This is extremely useful if you want to use your model in a program and don’t want to copy the preprocessing code.

    Example to crop and normalize image:

    inputs = keras.layers.Input(shape=(160,320,3))
    output = keras.layers.convolutional.Cropping2D(cropping=((55, 25), (0, 0)))(inputs)
    output = Lambda(lambda x: x/127.5 - 1., input_shape=imageshape, output_shape=imageshape)(output)
    
  • If you do preprocess in the model, preview the output.  You can do this by creating a temporary model and using predict.
    Example:

    def showLayerOutput(sample):
        model = Model(inputs=inputs, outputs=output)
        sample.showImage()
        croppedimage = model.predict(np.array([sample.getImage()]))[0]
        print(croppedimage)
        plt.imshow(croppedimage)
        plt.show()
    showLayerOutput(train_samples[0])
    
  • Use asserts on the shape of your model.  For example:
    assert output.shape[1:] == (1,31,64)
    
  • Print out some outputs!  This is really important to keep an eye on what the predictions are.  Are they never negative when you want them to be?  Are they never larger than one when you want them to be?  (You’re using the wrong activation function on the last layer). Is it always outputting zero or similar (learning rate too high?)
    In keras you do this with a callback.

    Example:

    class DebugCallback(keras.callbacks.Callback):
        def on_epoch_end(self, batch, logs={}):
            samples = train_samples[:5]
            print()
            print(logs)
            print("Should be: ", [sample.driving_angle for sample in samples])
            print("Predicted: ", [x[0] for x in model.predict(np.array([sample.getImage() for sample in samples]))] ) #Print predicted driving angle for first example
    
    debugCallback = DebugCallback()
    model.fit_generator(train_generator, epochs=200, steps_per_epoch= len(train_samples)/batch_size, validation_data=validation_generator, validation_steps =len(validation_samples)/batch_size, callbacks=[tbCallBack, checkpointCallback, reduce_lr, debugCallback])


Opinion polls

This is about a political post, but this post isn’t political but purely about the statistics.  A Lords Labour MP recently wrote:

We often read that there is a plus or minus 2 or 3% statistical margin of error in a poll. But what we are rarely reminded of is that this error applies to each party’s vote. So if a poll shows the Tories on 40% and Labour on 34%, this could mean that the real situation is Tory 43%, Labour 31% – a 12 point lead. Or it could mean both Tory and Labour are on 37%, neck and neck.

But is this true, mathematically?

When we say “Tories on 40% ± 3%”  we mean:

tory

A Normal Distribution with mean 40, and standard deviation of 3/1.96

Let’s plot both on the same graph:

both

Which was achieved in Wolfram Alpha with:

Plot[{PDF[NormalDistribution[40, 3/1.96], x], 
      PDF[NormalDistribution[34, 3/1.96], x]},
      {x, 30, 44}]

Now, could Labour and Tory really be neck and neck, within our 95% confidence?

If they are not correlated at all, then no:

To subtract normal distributions you have to do:

\sigma^2_{x-y} = \sigma^2_x + \sigma^2_y

so:
\sqrt{3^2 + 3^2} = 4.2

So, at 95% confidence, the difference in their lead is:  6 points ± 4.2.  As a plot:

subtract

The Neck-and-neck 0 point lead  and the 12 point lead are really unlikely outcomes! (0.3% in fact)

(Caveat:  Of course this all depends on the polls being accurate normal samples on the population).

But of course they are correlated… somewhat

If this was a two party system, with the total adding up to 100%, then the errors would be completely anti-correlated.  And if it was a many party system, with the total adding up to much less 100%, then we’d expect the errors to have a very weak correlation.  But with the errors adding up 70% we’re stuck in an awkward half-correlated stage.  Is there anything better that we can do?

Edit: Response from the Lords MP

I received a message from the MP:

I take your point but don’t entirely agree. The errors are associated ie high Tory is likely to mean low Labour and vice versa so these are linked contingencies.
But thanks for writing. And at least even if your point was accepted entirely it wouldn’t make any material difference to the conclusions of my article.
D


My self driving car

(This post is a work in progress, sorry. I’ll write it up better a bit later, honest!)

After a weekend of hacking around, I got a 95% accuracy rate on the validation and testing sets for recognizing road signs.  Here’s 5 random google images for ‘road sign photos’, and including one that fails:

Screenshot_20170424_124725.png

My neural network got 4 out of 5 of the signs correct, incorrectly thinking the first image was 120 km/h instead of 20 km/h.  But it gets it correct on its second guess.

This was done by just adapting the LeNet neural network for recognizing digits.  I did add two dropout layers with a 50% probability, and increased the number of classes to 30 and input size to 32x32x3, and that was about it.

I had 35,000 training images, but increased this to 60,000 images by rotating and zooming the images.  My network does overfit badly though (reaching 99% accuracy on the training set, after 10 epochs).

Erasing background from an image

I have two opaque images –  one with an object and a background, and another with just the background.  Like:

I want to subtract the background from the image so that the alpha blended result is visually identical, but the foreground is as transparent as possible.

E.g:

lion

Desired output (All images under Reuse With Modification license)

I’m sure that this must have been, but I couldn’t find a single correct way of doing this!

I asked a developer from the image editor gimp team, and they replied that the standard way is to create an alpha mask on the front image from the difference between the two images.  i.e. for each pixel in both layers, subtract the rgb values, average that difference between the three channels, and then use that as an alpha.

But this is clearly not correct.  Imagine the foreground has a green piece of semi-transparent glass against a red background.  Just using an alpha mask is clearly not going to subtract the background because you need to actually modify the rgb values in the top layer image to remove all the red.

So what is the correct solution?  Let’s do the calculations.

If we have a solution, the for a solid background with a semi-transparent foreground layer that is alpha blended on top, the final visual color is:

out_{rgb} = src_{rgb} * src_{alpha} + dst_{rgb} \cdot (1-src_{alpha})

We want the visual result to be the same, so we know the value of out_{rgb} – that’s our original foreground+background image.  And we know dst_{rgb} – that’s our background image.  We want to now create a new foreground image, src_{rgb}, with the maximum value of src_{alpha}.

So to restate this again – I want to know how to change the top layer src so that I can have the maximum possible alpha without changing the final visual image at all.  I.e. remove as much of the background as possible from our foreground+background image.

Note that we also have the constraint that for each color channel, that src_{rgb} \le 1 since each rgb pixel value is between 0 and 1.  So:

src_{alpha} \le (out_{rgb} - dst_{rgb})/(1-dst_{rgb})

So:

src_{alpha} = Min((out_r - dst_r)/(1-dst_r), out_g - dst_g)/(1-dst_g), out_b - dst_b)/(1-dst_b))\\ src_{rgb} = (dst_{rgb} \cdot (1-src_{alpha}) - out_{rgb})/src_{alpha}

Proposal

Add an option for the gimp eraser tool to ‘remove layers underneath’, which grabs the rgb value of the layer underneath and applies the formula using the alpha in the brush as a normal erasure would, but bounding the alpha to be no more than the equation above, and modifying the rgb values accordingly.

Result

I showed this to the Gimp team, and they found a way to do this with the latest version in git.  Open the two images as layers.  For the top layer do: Layer->Transparency->Add Alpha Channel.  Select the Clone tool.  On the background layer, ctrl click anywhere to set the Clone source.  In the Clone tool options, choose Default and Color erase, and set alignment to Registered.  Make the size large, select the top layer again, and click on it to erase everything.

Result is:

Screenshot_20170307_133539.png

When the background is a very different color, it works great – the sky was very nicely erased.  But when the colors are too similar, it goes completely wrong.

Overall..  a failure.  But interesting.

Practical Deep Neural Network in a few lines of code with TensorFlow

This is using the very latest TensorFlow tf.contrib.learn API.  The documentation is extremely thin, and as of writing there are no tutorials out there similar to this.  The API may change, and I don’t actually know if I’m doing things correctly.  This is just trial and error 🙂

So let’s say you want to:

  1. Train a Deep Neural Network by using some existing data, and training it against known labels.  e.g. labeled images.
  2. Use that trained network in your app to predict y given x.  E.g. guess the best label for a given image

    And as a bonus:

  3. Have some nice graphs of how well the training is doing

I assume that the data you have in a plain array-of-arrays or numpy 2D array.  It should be easy to change this to use csv or panda etc data. A row is a single example, and a column is a particular feature (e.g. house price, or pixel intensity at a specific location)

So, without further ado, here’s the function that will be shared between your training and your app

def get_tf_model():
    """ Setup our Deep Neural Network and LOAD any existing model
       
        Returns:
          ( Our (maybe trained) model, a helper input function)
    """
    # FEATURES is a short description for each column
    # of your data.  Change this to match your data
    FEATURES = ["x1", "x2"]
    # Set this to describe your columns.  If they are all real values,
    # you don't need to change it.
    feature_columns = [tf.contrib.layers.real_valued_column(k) for k in FEATURES]

    # Build 3 layer DNN.  You can change this however you want, or use a
    # linear regressor, or use a classifier etc.
    # NOTE:
    #   This will LOAD any existing model in the "model_dir" directory!
    # The documentation fails to mention this point as of writing
    regressor = tf.contrib.learn.DNNRegressor(feature_columns=feature_columns,
                                              hidden_units=[128, 128, 128],
                                              model_dir="tf_model")

    def input_fn(x_data, y_data = None):
        # Note the 'shape' parameter is to suppress a very noisy warning.
        # You can probably remove this parameter in a month or two.
        feature_cols = {k: tf.constant(x_data[:,i], shape=[len(x_data[:,i]), 1])
                        for i, k in enumerate(FEATURES)}
        if y_data is None:
            return feature_cols
        labels = tf.constant(y_data)
        return feature_cols, labels

    return regressor, input_fn

Now the code for training. Note that it’s absolutely fine to carry on training a model that is already trained, if you have some new data for it.

x_test = None
y_test = None
regressor, input_fn = get_tf_model()

def train(training_data_y, training_data_x):
    global x_test, y_test, regressor, input_fn

    if x_test is None:
        x_train = np.array(training_data_x[:-20], dtype=np.float32)
        x_test = np.array(training_data_x[-20:], dtype=np.float32)
        y_train = np.array(training_data_y[:-20], dtype=np.float32)
        y_test = np.array(training_data_y[-20:], dtype=np.float32)
    else:
        x_train = np.array(training_data_x, dtype=np.float32)
        y_train = np.array(training_data_y, dtype=np.float32)

    print("Training model ...")
    # Fit model.
    regressor.fit(input_fn=lambda: input_fn(x_train, y_train), steps=2000)

    ev = regressor.evaluate(input_fn=lambda: input_fn(x_test, y_test), steps=1)
    print('  -  Trained Loss: {0:f}'.format(ev["loss"]))

And now finally, the code to use this model in the app. Note that no explicit loading is needed, because it’s loading it from the model_dir
 

regressor, input_fn = get_tf_model()
def predict(x_data):
    return regressor.predict(input_fn=lambda:input_fn(x_data))

Isn’t that simple?

 
We can also view a graph of the loss etc with:

tensorboard tf_model  # or whatever you set model_dir to

Then navigating to http://127.0.1.1:6006/ in the browser

Worst/Trickiest code I have ever seen

It’s easy to write bad code, but it takes a real genius to produce truly terrible code.  And the guys who wrote the python program hyperopt were clearly very clever.

Have a look at this function:  (don’t worry about what it is doing) from tpe.py

# These produce conditional estimators for various prior distributions
@adaptive_parzen_sampler('uniform')
def ap_uniform_sampler(obs, prior_weight, low, high, size=(), rng=None):
    prior_mu = 0.5 * (high + low)
    prior_sigma = 1.0 * (high - low)
    weights, mus, sigmas = scope.adaptive_parzen_normal(obs,
        prior_weight, prior_mu, prior_sigma)
    return scope.GMM1(weights, mus, sigmas, low=low, high=high, q=None,
size=size, rng=rng)

The details don’t matter here, but clearly it’s calling some function “adaptive_parzen_normal”  which returns three values, then it passes that to another function called “GMM1”  and returns the result.

Pretty straight forward?  With me so far?  Great.

Now here is some code that calls this function:

fn = adaptive_parzen_samplers[node.name]
named_args = [[kw, memo[arg]] for (kw, arg) in node.named_args]
a_args = [obs_above, prior_weight] + aa
a_post = fn(*a_args, **dict(named_args))

Okay this is getting quite messy, but with a bit of thinking we can understand it.  It’s just calling the  ‘ap_uniform_sampler’  function, whatever that does, but letting us pass in parameters in some funky way.

So a_post is basically whatever “GMM1” returns  (which is a list of numbers, fwiw)

Okay, let’s continue!

fn_lpdf = getattr(scope, a_post.name + '_lpdf')
a_kwargs = dict([(n, a) for n, a in a_post.named_args if n not in ('rng', 'size')])
above_llik = fn_lpdf(*([b_post] + a_post.pos_args), **a_kwargs)

and that’s it.  There’s no more code using a_post.

This took me a whole day to figure out what on earth is going on.  But I’ll give you, the reader, a hint.  This is not running any algorithm – it’s constructing an Abstract Syntax Tree and manipulating it.

If you want, try and see if you can figure out what it’s doing.

Answer: Continue reading →

Python – Hyperopt – Finding the optimal hyper parameters

This comes up as a very common question in ##machinelearning chat room – How do you chose the right parameters for your Neural Network model?  How do you chose how many hidden layers to use, or what your drop out parameter should be, or what the learning rate should be, and so on?

Or in other fields, say you’re doing an engineering or science experiment, how do you chose the right parameters to test?

This problem is called hyperoptimization.

One possible way is to do a “grid search”.  You keep all the parameters constant, then vary one by one and see what effect it has.  You adjust a different parameter, then repeat on the first parameter, trying to either to test out every possible combination.  The trouble is that the number of combinations blows dramatically, to the power of the number of parameters.

But never fear – there are smarter ways to do this, including random search, Bayesian Search, and Tree of Parzen Estimators (TPE).  The good thing is that you don’t actually need to know any of this is, in order to actually use it.

Let’s take a toy example, and since it’s valentines at the time of writing, let’s imagine instead our error space is:

heart.png

Toy hyperparameter space function.  I spent way too long making this pretty 😉

Where the axes are filling in for our hyperparameters (e.g. learning rate, size of hidden layer), and the z value is our error value (e.g. percentage of cat photos incorrectly identified as dogs, etc.  Something that we want to minimize).

This diagram was generated with the notebook python code:


%matplotlib notebook
import matplotlib.pyplot as plt
import numpy as np

def heart(x, y):
    return -((x**2 + y**2 - 1)**3 - x**2 *y**3);

x = y = np.arange(-2, 2, 0.01)
X, Y = np.meshgrid(x,y)
Z = heart(X, Y)

plt.figure()
def plotHeart():
CS = plt.contour(X, Y, Z, levels=[-0.5, -0.2, -0.1, 0, 1, 20],
            colors=["0.9", "0.9", "0.9", "red", "0.9", "0.9"])
plt.clabel(CS, inline=1, fontsize=10)
plotHeart()

So, say you’ve written a Tensorflow, or keras, or scipy, etc program in Python.  For example, tensorflow/mnist.py.  Have a quick look at that – see how they’ve got various hyperparameters that need tuning.  There’s some complicated error function that we can’t directly visualize, in some high dimensional hyperparameter space.  And we’re trying to find the parameters that minimize this error.

Here’s my dummy program that will stand in for your complex number or cat recognition program:

class HyperParameters:
    def __init__(self):
        self.learning_rate = 1
        self.size_of_hidden_layer = 1

    def runAndGetError(self):
        """This function should call your tensorflow etc
        code which does the whole training procedure and returns
        the TRAINING error.  Lower is better!"""
        return heart(self.learning_rate, self.size_of_hidden_layer)
hyperparameters = HyperParameters();

def main():
    pass # This is where you do all the normal training code etc

if __name__ == "__main__":
    main()

Note that we’ve got a class for all our hyperparameters.  I recommend you having this!  Note also that we don’t actual run the training unless __name__ == “__main__”.  The point here is to make sure that our program runs as normal if we just run it directly, but we can also create a second program that uses hyperopt to tune this without having to touch our main program at all.  This sort of separation is really nice.

You can put discrete ints, category ints, real, bools, etc in the

Don’t put any hyperopt code in your main program!

Now, without touching your main program at all, we create our hyperopt tuner:

#!/usr/bin/python3
from hyperopt import fmin, tpe, hp, STATUS_OK, Trials
import heart.hyperparameters as hyperparameters  # heart.py in the same folder
import numpy as np
import signal
import sys
import pickle

# The key in the space must match a variable name in HyperParameters
space = {
    'learning_rate': hp.uniform('learning_rate', -2, 2),
    'size_of_hidden_layer': hp.uniform('size_of_hidden_layer', -2, 2),
}

num_trials = 10
trials = Trials()

def summarizeTrials():
    print()
    print()
    print("Trials is:", np.sort(np.array([x for x in trials.losses() if x is not None])))

def main():
    global trials
    loadFromPickle = True
    try:
        if loadFromPickle:
            trials = pickle.load(open("hyperopt.p", "rb"))
    except:
        print("Starting new trials file")

    def objective(args):
        for key, value in args.items():
            if int(value) == value:
                value = int(value)
            setattr(hyperparameters, key, value)
        score = hyperparameters.runAndGetError()
        #print("Score:", score, "for", args)
        return {'loss': score, 'status': STATUS_OK}

    for i in range(num_trials):
        best = fmin(objective,
                space=space,
                algo=tpe.suggest,
                max_evals=(i+1),
                trials=trials)
        save_trials()
    summarizeTrials()
    print(i, "Best result was: ", best)

def save_trials():
    pickle.dump(trials, open("hyperopt.p", "wb"))

def signal_handler(signal, frame):
    summarizeTrials()
    save_trials()
    sys.exit(0)
signal.signal(signal.SIGINT, signal_handler)

if __name__ == '__main__':
    main()

And now let’s plot this to see what is going on and see how hyperopt is going to sample from our space:

results = [ (x['misc']['vals']['learning_rate'][0], x['misc']['vals']['size_of_hidden_layer'][0]) for x in trials.trials if 'loss' in x['result']]
plt.figure()
for i, result in enumerate(results):
    plt.annotate(i, xy = result, va="center", ha="center")
plotHeart()
plt.show()
heart2

Hyperopt TPE testing 10 samples from our space.  First trial labeled ‘0’

heart3

These suggestions for trial evaluations look awful!  Why is not sampling close to the middle, where there are known good results?

What on earth is hyperopt doing?

It hasn’t even come close to the minimum points (at 0,0), while with just 10 samples, three of the samples are all bunched right next to each other.  On repeated runs, sometimes 50% of the points are right on the border too!

Even with 50 samples you end up with clumping, and even though it finds an excellent value at 2, it doesn’t improve on that even after 48 samples!

There has to be something going on here.

Strange Hyperopt behavior

Digging into the hyperopt code, turns out that there’s a:

_default_n_startup_jobs = 20

parameter.  So for the first 20 runs, the ‘TPE’ behavior isn’t used at all.  Digging around in the code reveals that this can be adjusted in our code by using:

from functools import partial
...    best = fmin(objective,...
                algo=partial(tpe.suggest, n_startup_jobs=1),

Which now produces:

heart4.png

Which is looking a lot nicer!

I’m not very happy with the initial sampling – just look at the position of the first 5 trials, but this is already a lot better.  But let’s try to crack open this black box a bit.


How it works.

  1. We split our experimental observations into a small number of Good Observations, and the rest as the Bad Observations.  They are split by how badly they did (e.g. percentage of images that they incorrectly classified).  The uses uses the least-bad  γ·√(num_observations) fraction for the good observations (obs_good) and the rest for the bad observations (obs_bad).This is done in the code with:
    obs_good, obs_bad = scope.ap_filter_trials(obs_x, obs_y, gamma)
  2. Pick random values of x. but making it more likely to pick values of x which are similar to the x values in the Good Observations that we’ve already seen.  So if x=3 and x=6 usually give a good result, we’re more likely to pick values close to that.  This is mathematically done by sampling from a Gaussian Mixture Model comprised of Gaussians with a mean of each good observation’s x value.

    This is done in code with: (I’ve renamed the variables)

    good_weights, good_mus, good_sigmas = adaptive_parzen_normal(
                         obs_good, prior_weight, prior_mu, prior_sigma)
    x_samples = scope.GMM1(weights, mus, sigmas)
  3. Calculate p(x | y is good) for our Good Samples and p(x | y is bad) for the Bad Samples.  This is done by getting the probability density of the Gaussian Mixture Model for each sample value.  As an implementation note, hyperopt actually calculates the log for each of these values (llik = log likelihood).

    Now, in code, this is actually done in a very complicated way that I decided to devote its own post to.

    So here instead is the equivalent of what is done in code:

    bad_weights, bad_mus, bad_sigmas = adaptive_parzen_normal(
                         obs_bad, prior_weight, prior_mu, prior_sigma)
    good_llik = GMM1_lpdf(x_samples, good_weights, good_mus, good_sigmas)
    bad_llik = GMM1_lpdf(x_samples, bad_weights, bad_mus, bad_sigmas)
  4. Find x value that maximizes the Expected Improvement: Chose the x value from our x_samples that maximizes:    p(x | y is good) / p(x | y is bad).   This is mathematically equal to choosing the x value that maximizes log(p(x | y is good) – log(p(x | y is good).

    This is done in code with:

     score = good_llik - bad_llik  # Element-wise vector subtraction
     best = np.argmax(score)
     memo = x_samples[best]
  5. Repeat for each hyperparameter.  Note that this assumes that every hyperparameter is completely independent from the others, which is obviously false.  To compensate, it weights older observations lower than newer ones, in the hope that it starts to converge all the parameters to good parameters that don’t change much.

Let’s put this all together, and graph what is going on:

def miscs_to_idxs_vals(miscs):
keys = list(miscs[0]['idxs'].keys())
idxs = dict([(k, []) for k in keys])
vals = dict([(k, []) for k in keys])
for misc in miscs:
for node_id in idxs:
t_idxs = misc['idxs'][node_id]
t_vals = misc['vals'][node_id]
assert len(t_idxs) == len(t_vals)
assert t_idxs == [] or t_idxs == [misc['tid']]
idxs[node_id].extend(t_idxs)
vals[node_id].extend(t_vals)
return idxs, vals

def get_lpdf_ast(parameter_name):
idxs, vals = miscs_to_idxs_vals(trials.miscs)
idxs = idxs[parameter_name]
vals = vals[parameter_name]
losses = trials.losses()

from hyperopt import pyll
from hyperopt.tpe import ap_filter_trials
from hyperopt.tpe import adaptive_parzen_samplers

qu = space[parameter_name].pos_args[0].pos_args[1] #pyll.scope.uniform(-2, 2)
fn = adaptive_parzen_samplers['uniform']
fn_kwargs = dict(size=(4,), rng=np.random)
s_below = pyll.Literal()
s_above = pyll.Literal()
b_args = [s_below, prior_weight] + qu.pos_args
b_post = fn(*b_args, **fn_kwargs)
a_args = [s_above, prior_weight] + qu.pos_args
a_post = fn(*a_args, **fn_kwargs)

start_val = space[parameter_name].pos_args[0].pos_args[1].pos_args[0].eval()
end_val = space[parameter_name].pos_args[0].pos_args[1].pos_args[1].eval()
x_samples = np.arange(start_val,end_val,0.1)

# print b_post
# print a_post
fn_lpdf = getattr(pyll.scope, a_post.name + '_lpdf')
# calculate the llik of b_post under both distributions
a_kwargs = dict([(n, a) for n, a in a_post.named_args
if n not in ('rng', 'size')])
b_kwargs = dict([(n, a) for n, a in b_post.named_args
if n not in ('rng', 'size')])
below_llik = fn_lpdf(*([x_samples] + b_post.pos_args), **b_kwargs)
above_llik = fn_lpdf(*([x_samples] + a_post.pos_args), **a_kwargs)
new_node = pyll.scope.broadcast_best(x_samples, below_llik, above_llik)

return s_below, s_above, below_llik, above_llik, new_node

def get_lpdf(ii, s_below, s_above, below_llik, above_llik, new_node):
below, above = ap_filter_trials(idxs[:ii], vals[:ii], idxs[:ii], losses[:ii], gamma)
memo = {s_below: below, s_above: above}
bl, al, nv = pyll.rec_eval([below_llik, above_llik, new_node],
memo=memo)
return bl, al, nv
parameter_name = "learning_rate"
s_below, s_above, below_llik, above_llik, new_node = get_lpdf_ast(parameter_name)
plotAnnotatedHeart()
plt.show()
plt.figure()
plt.text(0.06, 0.5, '⟵ Number of Trials', ha='center', va='center', rotation='vertical')
num_subplots = 10
subplot_i =1
for ii in range(1, len(idxs)-1, 1+int(len(idxs)/num_subplots)):
if ii > len(idxs):
break
bl, al, nv = get_lpdf(ii, s_below, s_above, below_llik, above_llik, new_node)
plt.subplot(num_subplots, 1, subplot_i)
subplot_i += 1
plt.plot(all_vals, bl, c='g')
plt.plot(all_vals, al, c='r')
plt.plot(all_vals, bl-al, c='k')
plt.axvline(nv[0], c='k')
plt.show()

Phew!   That took… quite a lot of code!  I wish hyperopt made this easier.  I should try to make a patch for hyperopt to make it easier.

Anyway, so here’s the result (drum roll).  First the loss function overlaid with where we are running our trials:

heart5heart6-graph

The graph on the bottom is for the x axis only variable of the heart graph.  The x axis is the same, and the y axis is the log(p(x|y is good) in green, log(p(x|y is bad)) in red, and log(p(x|y is good) – p(x|y is bad)) in black.  The vertical part indicates the largest value for the black line, which is the x value that will give the Maximum Improvement to the energy.  We have one graph after every 10 trials, with the bottom graph being after 100 trials (aka observations).

We can start to see what is going wrong here.  I don’t like that it’s not sampling the center enough, even though it can clearly see that the highest energy is there (the green peaks there).  I don’t like that it tends to clump together measurements.  I’m sure with a bit of thinking we can do better than this!

But I’ll think about it and leave that for another post.


More realistic example

Here’s a hyperopt ‘space’ that I used for Q-Learning, to give an idea of the options for a more realistic model:

# The key in the space must match a variable name in HyperParameters
space = {
    # Learning rate should be between 0.00001 and 1
    'learning_rate':
        hp.loguniform('learning_rate', np.log(1e-5), np.log(1)),
    'use_double_q_learning':
        hp.choice('use_double_q_learning', [True, False]),
    'layer1_size': hp.quniform('layer1_size', 10, 100, 1),
    'layer2_size': hp.quniform('layer2_size', 10, 100, 1),
    'layer3_size': hp.quniform('layer3_size', 10, 100, 1),
    'future_discount_max': hp.uniform('future_discount_max', 0.5, 0.99),
    'future_discount_increment':
        hp.loguniform('future_discount_increment', np.log(0.001), np.log(0.1)),
    'recall_memory_size': hp.quniform('recall_memory_size', 1, 100, 1),
    # This doesn't tune very well:
    # 'random_action_epsilon':
    #    hp.loguniform('random_action_epsilon', np.log(0.0001), np.log(0.1)),
    'recall_memory_num_experiences_per_recall':
       hp.quniform('recall_memory_num_experiences_per_recall', 10, 2000, 1),
    'num_epochs': hp.quniform('num_epochs', 1, 10, 1),
}